
You can view the code and graphs in the Colab notebook that I've posted.
I used Selenium and NBA_API to scrape the data that I used for the regression analysis.
I thought it would be easy to join the data until I perused the salary data and saw that some of the players, such as P.J. Washington, didn't have periods in their names. I had faced this problem earlier when joining data between Yahoo API and NBA API in which certain players' names wouldn't match up with the other names.
Thus, I wrote an algorithm to try to match the names between the two lists. I wanted to write a relatively simple algorithm so there are some false positives such as the match between Justin and Jerome Robinson. Luckily, the list was small enough to manually correct.
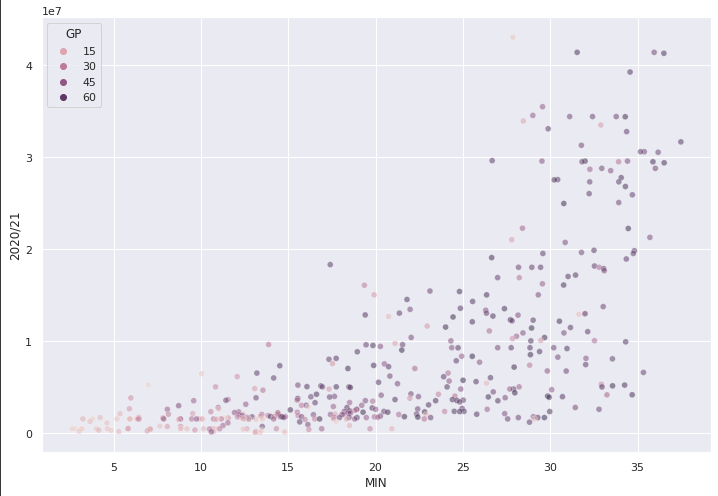
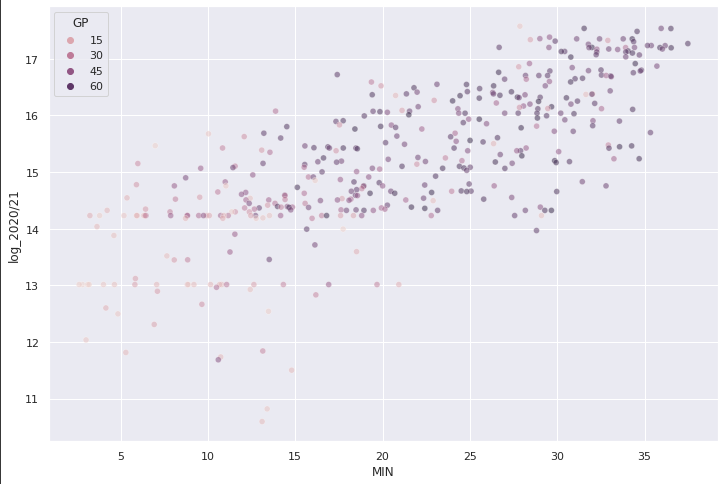
When I was exploring the data, I was able to make the relationship between salary and minutes per game look more linear on the scatterplot. I did this by applying a natural log transformation on salary. Unfortunately, the log transformation on salary made the other variables less linear with salary.
I remember from my machine learning class that a lot of the modelling we did involved doing cross-validation to prevent overfitting and comparing models by using their expected root mean squared error in R. When covering new models, the professor would tell us to throw the new model into the cross validation arena to duke it out with the other models. I decided to replicate this in Python.

One thing I enjoyed about modelling in Python is that the model parameters are all quite similar. Some of the models in R require training and test data split into X and y while some just need data split into training and test data. In addition, all the cross validation we did in class was done manually by randomly sampling indices. It's really nice to just be able to cross validate with one line of code and just use the data set for every model instead of having to figure out whether or not you needed to further split the data.
While I was testing the voting ensemble, the voting ensemble did better than both the LASSO and Random Forest models. However, in my subsequent tries it ended up being similar to LASSO and Random Forest. I wasn't able to figure out how to make it reproducible. I tried setting the random_state parameter for as many things in the code chunk as I could but it still wasn't reproducible. This was the same for the random forest importance plot results.